Signal Lost: When Your Observability Stack Becomes the Problem It Was Built to Solve
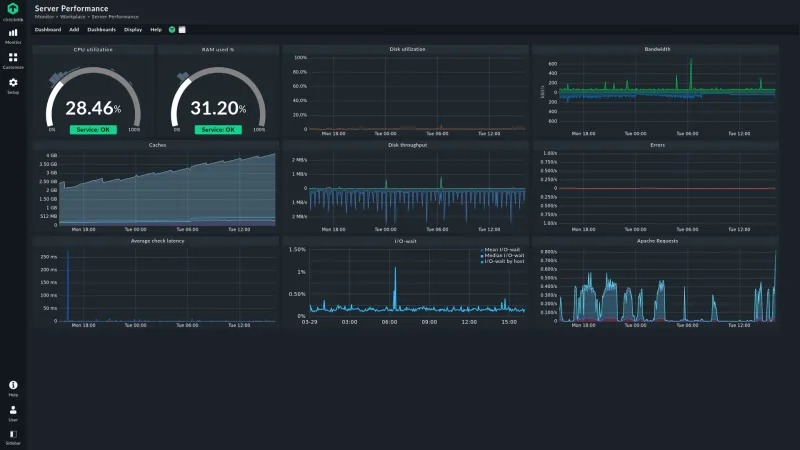
Photo: server monitoring dashboard screens data center operations, via checkmk.com
At some point in the past decade, the observability industry underwent a quiet transformation. What began as a practical discipline—understanding what production systems were doing and why—evolved into an elaborate ecosystem of platforms, agents, exporters, dashboards, and alerting pipelines that now constitute some of the most complex infrastructure an engineering team operates. The irony is that this complexity, accumulated in pursuit of visibility, has made many production environments significantly harder to understand.
The term for this condition is observability theater: the deployment of monitoring tooling at sufficient scale to create organizational confidence in production visibility, without that tooling actually delivering the signal fidelity required to catch critical failures before they reach users.
How Monitoring Stacks Accumulate Complexity
No engineering organization sets out to build an unmanageable monitoring infrastructure. The path there is gradual and, at each individual step, entirely rational.
A team adopts a metrics platform early in its lifecycle. As the application grows, distributed tracing becomes necessary. A log aggregation service is added to handle the volume of application output. A synthetic monitoring tool is deployed to validate user-facing flows. An on-call alerting platform is layered on top to route notifications. A cost observability product is introduced after a billing surprise. Each addition solves a real problem at the moment of adoption.
What accumulates over time is a stack of tools that were never designed to operate cohesively. Data lives in separate systems with inconsistent schemas. Correlation between a trace, a log event, and a metrics anomaly requires manual context-switching across multiple interfaces. Alert definitions are distributed across platforms, maintained by different team members with different threshold philosophies, and subject to configuration drift that nobody has time to audit.
The result is an environment where a critical production failure can be simultaneously generating alerts in three different systems, none of which contain sufficient context on their own to diagnose the root cause—and all of which are competing for attention with dozens of lower-severity notifications that have been firing so consistently they have become ambient noise.
The Alert Fatigue Feedback Loop
Alert fatigue is not a new concept, but its consequences in over-instrumented environments are more severe than the term suggests. When engineers receive alert volumes that exceed their cognitive capacity to evaluate, the rational adaptation is triage heuristics: which alert channels have historically indicated genuine problems, and which can be safely deprioritized.
This adaptation is understandable, but it creates a dangerous feedback loop. Alerts that are frequently ignored stop being maintained. Thresholds that were set arbitrarily at implementation time never get tuned. The signal-to-noise ratio degrades further, which reinforces the heuristic that most alerts can be deprioritized. Eventually, the alerting system becomes a background process that engineers monitor with peripheral attention—until a genuine failure arrives through a channel that has been mentally downgraded.
Post-incident reviews frequently surface this dynamic. The data indicating a problem was present in the monitoring stack. Sometimes it was even generating alerts. But those alerts were indistinguishable from the volume of lower-priority notifications that the on-call engineer had learned to scan past.
Vendor Lock-In and the Instrumentation Arms Race
Observability vendor relationships introduce a structural pressure that compounds the complexity problem. Most enterprise observability platforms are priced on data ingestion volume, which creates an incentive to instrument extensively and a disincentive to rationalize or reduce data collection. The vendor's business model and the customer's operational clarity are, in this respect, partially misaligned.
Additionally, migrating instrumentation away from a deeply integrated observability platform is expensive. Custom dashboards, alert configurations, and data retention policies are all platform-specific. Teams that have invested heavily in a particular vendor's tooling find themselves constrained in their ability to adopt sampling strategies, reduce cardinality, or restructure their instrumentation architecture—because doing so would require rebuilding institutional knowledge that exists only inside the vendor's interface.
This is a form of infrastructure lock-in that receives considerably less attention than its cloud compute equivalent, but its operational consequences are comparably significant.
Recovering Signal From the Noise
Restoring genuine observability to an over-instrumented environment requires accepting a counterintuitive premise: less data, collected with more intentionality, typically produces better operational outcomes than comprehensive data collection with inadequate structure.
The starting point is an alert audit. Every active alert definition should be evaluated against a simple criterion: what action does this alert require from the engineer who receives it, and how often does receiving this alert actually lead to that action? Alerts that consistently result in no action—or in acknowledgment without investigation—are candidates for suppression or threshold revision, not refinement. They are consuming on-call attention that should be reserved for alerts that demand it.
The second intervention is establishing a clear hierarchy of signal types. Not all observability data carries equal operational weight. Alerts that indicate direct user impact—error rate thresholds on critical paths, latency breaches on revenue-generating flows, availability failures on core infrastructure—should be structurally separated from informational signals that support investigation but do not require immediate response. Conflating these categories in a single alerting channel is one of the primary mechanisms through which critical signals get lost.
The third intervention is instrumenting for correlation from the start, rather than treating correlation as a post-hoc investigation step. Distributed tracing is only as useful as the consistency with which trace context is propagated across service boundaries. Log events are only as useful as the structured fields that allow them to be joined against metrics and traces. These are instrumentation decisions, not tooling decisions—and they require deliberate engineering investment.
Visibility Is Not Instrumentation
The most important conceptual shift for teams struggling with observability complexity is recognizing that visibility and instrumentation are not the same thing. Instrumentation is the mechanism. Visibility is the outcome. An organization can deploy every observability tool on the market and still have no genuine understanding of what its production systems are doing—if those tools are generating more noise than signal.
Building genuine observability requires treating monitoring infrastructure with the same engineering rigor applied to the systems it monitors: clear ownership, regular review cycles, explicit quality criteria, and the discipline to remove complexity that is not earning its keep.